In-Depth: Jitter
1 Introduction
Jitter is a variation in packet transit delay caused by queuing, contention and serialization effects on the path through the network. In general, higher levels of jitter are more likely to occur on either slow or heavily congested links. It is expected that the increasing use of “QoS” control mechanisms such as class based queuing, bandwidth reservation and of higher speed links such as 100 Mbit Ethernet, E3/T3 and SDH will reduce the incidence of jitter related problems at some stage in the future, however jitter will remain a problem for some time to come.
This contribution discusses the root causes and statistical characteristics of jitter, provides some practical measurement results and then discusses ways in which jitter can be measured and modeled. Finally the operation of jitter buffers is briefly discussed in order that the interaction between jitter and jitter buffers can be better understood.
The general context of the discussion below is Voice over IP however applies equally to packet video and other forms of real time jitter sensitive traffic.
2 Root causes of jitter
2.1 Terminology
In order to facilitate later discussion we will define several types of jitter:-
(i) Type A – constant jitter. This is a roughly constant level of packet to packet delay variation. (ii) Type B – transient jitter. This is characterized by a substantial incremental delay that may be incurred by a single packet. (iii) Type C – short term delay variation. This is characterized by an increase in delay that persists for some number of packets, and may be accompanied by an increase in packet to packet delay variation. Type C jitter is commonly associated with congestion and route changes.
2.2 Sending system packet scheduling (Type B)
In some systems, notably soft phones, the VoIP process has to contend for CPU time with other processes and hence there may be some transmit time jitter introduced by scheduling delays.
2.3 LAN Congestion (Type B)
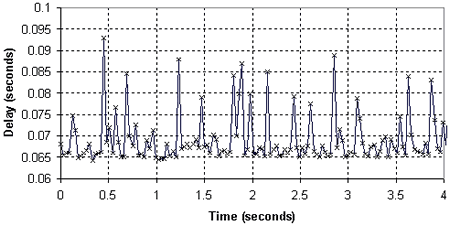
Although average LAN utilization is typically quite small, congestion does often occur during short periods. Worst case delay variation is bounded by the maximum back-off time used in the Ethernet contention algorithm and in some systems is also bounded by the inter-packet delay. If the VoIP end system has been unable to get access to the LAN by the maximum back-off time or by the time the next packet is scheduled for transmission then it may discard the packet. In the case of 100 Mbit Ethernet the maximum back-off time is in the millisecond range and hence should not be a major source of jitter. In the case of 10 Mbit Ethernet the maximum backoff time is much higher than the VoIP packet spacing and hence the jitter may bounded by packet spacing, typically 10-30 milliseconds. LAN congestion typically results in a spiky delay waveform as one packet may be delayed however the following packet may get access to the LAN immediately.
|
| Figure 1. Example of LAN congestion (x = packet) |
2.4 Firewall Router (Type B/C)
Certain types of Firewall Router (notably “double socket”) terminate the IP stream on one side of the Firewall and recreate it on the other. This provides additional security as only certain controlled parts of the payload are forwarded however does introduce additional delay and hence delay variation. With the migration of Firewall functionality into silicon this is less likely to be a problem.
2.5 Access Link Congestion (Type C)
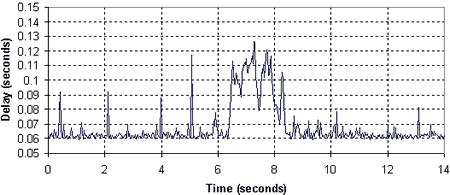
Access links are typically a major source of jitter as they represent one of the bottlenecks along the packet path. For example, the serialization delay for a 1500 byte IP packet sent through a T1 (1.544Mbit) link is approximately 8 milliseconds therefore if five data packets are queued before a voice packet then an additional 40 milliseconds of transient delay is introduced. This problem can be severe in the case of ISDN, ADSL or Cable Modems in which the upstream bandwidth can be even more restricted; for example if the upstream bandwidth is 384kBits per second then each queued 1500 byte IP packet would introduce an extra 30 milliseconds of delay!
|
| Figure 2. Example of Access Link Congestion |
2.6 Load sharing amongst multiple access links or IP service providers (Type A)
In order to provide resilience some Enterprise VoIP traffic may be routed over multiple access links to a single IP service provider or diversely routed via several independent IP service providers. This can introduce jitter if the delays across each service or access link differ significantly.
2.7 Load sharing within an IP service (Type A)
Some IP service providers routinely route traffic over multiple internal routes within their networks in order to improve resilience and provide more even network loading. This introduces jitter resulting from the difference in delay on each route.
2.8 Internal load sharing within routers (Type A)
In order to support high capacity some routers employ a multi-processing approach in which packets are processed by multiple parallel queues. This can introduce low levels of jitter due to short term differences in queue size.
2.9 Routing table updates (Type B)
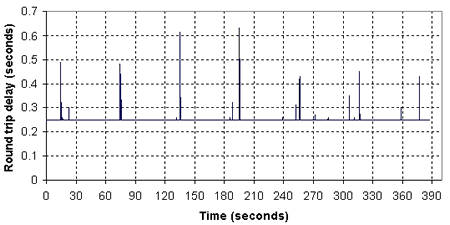
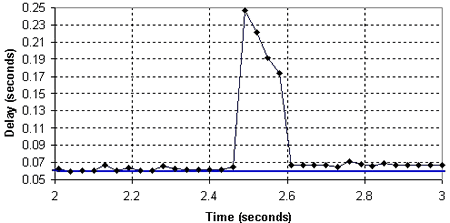
Routers perform occasional routing table updates and send update traffic with high priority. Each such event can cause a small number of packets to be delayed. In addition during routing table updates transient loops can exist that can lead to extremely high delays for isolated packets.
|
| Figure 3. Periodic delay events typical of routing table updates |
|
| Figure 4. Delay event preceding route change typical of a routing table update |
2.10 Route flapping (Type B)
Route changes can occur due to changing congestion levels, link failures and other causes. Route flapping is a low frequency oscillation in which routes “flap” backwards and forwards each time a routing table update occurs. Route changes in general are not regarded as jitter however the event of delay changing is perceived by the VoIP end system as a transient jitter event.
2.11 Timing drift (Type B)
Although timing drift is not jitter per se, it can result in occasional “jitter buffer events” as the jitter buffer either periodically overflows or underflows (e.g. [5]). In addition, if an NTP server is in use then the timing can be periodically reset, giving a slow “sawtooth” delay waveform. Typical crystals have a frequency tolerance of 30 parts per million (plus 50ppm due to temperature drift) and ceramic resonators 300ppm. A 30ppm frequency error can lead to almost 2 milliseconds per minute of frequency drift, which can be significantly increased due to temperature effects.
2.12 Measurement system effects
Unless hardware timestamping of received packets and a precision temperature compensated crystal are used in the measurement system then some of the effects described above can also apply to the path between the physical media being monitored and the monitoring application.
3 Jitter Measurement
Various approaches have been used for measuring jitter however no measures to date appear to provide good representation of the three types of jitter described above.
3.1 Mean packet to packet delay variation
Packet to packet delay variation is used as a basis for the RTCP (RFC1889) jitter measurement. If the delay of two successive packets is t1 and t2 then the packet to packet delay variation is abs( t2-t1).
The mean packet to packet delay variation is therefore:
MPPDV = mean( abs(ti – ti-1) )
The value calculated using this approach corresponds to the peak to peak jitter level only if the packets arrive alternately early and late. For example, if packets arrived according to the following sequence early, early, late, late then the reported value would be half that for the sequence early, late, early, late.
RTCP (RFC1889) calculates a running estimate of this mean using the following approach:
estimated mean Ji = (15.Ji-1 + abs(ti - ti-1) ) / 16
It is important to note that in the case of RTCP, the value reported only reflects the most recent few hundred milliseconds before the value was calculated. If an RTCP report is sent every 10 seconds then no useful information is available concerning over 95% of the time between reports.
3.2 Mean absolute packet delay variation
If the nominal arrival time (denoted below ai) for a packet is known or can be determined then the absolute delay variation is abs(ti – ai).
The mean absolute packet delay variation is therefore:
MAPDV = mean( abs(ti – ai) )
This value can be misleading if a delay change occurs (e.g. route change), as a constant offset would be included. As even fixed jitter buffers can adapt to delay shifts this means that the reported jitter value would not necessarily be a good indicator of ideal jitter buffer size or discard rate.
An alternative approach is to determine the mean absolute packet delay variation with regard to a short term average or minimum value – termed here the adjusted absolute packet delay variation. This can provide a more meaningful relationship to jitter buffer behavior.
mean delay Di = (15.Di-1 + ti-1) / 16 positive deviation Pi = ti – Di if ti > Di negative deviation Ni = Di - ti if ti < Di MAPDV2 = mean( Pi )+ mean(Ni )
|
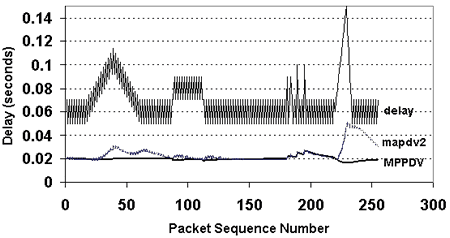
| Figure 5. Comparison of Running Average Packet-to-Packet and Adjusted Absolute Delay Variation values for simulated jitter distribution |
As shown on the above chart, both MPPDV and MAPDV2 react similarly to constant levels of jitter and to high variability in delay however MPPDV does not detect the ramp-like delays characteristic of access link congestion.
|
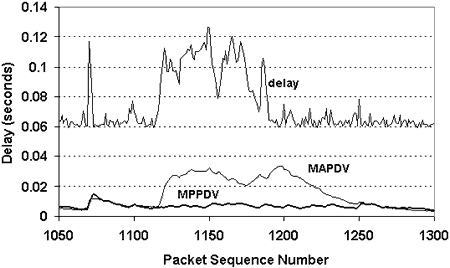
| Figure 6. Comparison of Running Average Packet-to-Packet and Adjusted Absolute Delay Variation values for a congestion event |
3.3 Y.1541 IPDV Parameter
Y.1541 defines IP Delay Variation in terms of the difference between the minimum and maximum transmission delays during some time interval.
IPTDmin = Minimum IP transmission delay
IPTDupper = 99.9% percentile of IP transmission delay
IPDV = IPTDupper – IPTDmin
This parameter is affected by the length of the measurement interval. In the figure above the IPDV would be approximately 60 milliseconds during the complete interval and it would be hard to relate this to the expected number of discards. If the measurement interval were very short (say 200 milliseconds) then the IPDV within each measurement interval could be used to estimate if a high discard rate was likely. This could be used then to determine the percentage of measurement intervals that were likely to be associated with high discard rates.
3.4 Packet delay variation histograms
Any of the above approaches to jitter measurement can be used to produce a histogram of the jitter level during short periods of time. This facilitates observations such as “jitter level exceeded 50 milliseconds for x% of the call” or “the 95th percentile of jitter was y milliseconds”. This approach can be applied to either packet-to-packet or adjusted absolute packet delay variation.
3.5 Time Series Analysis
An alternative approach that shows considerable promise is based on Time Series Analysis. In a typical time series model, a random sequence is fed into a filter function and the statistical properties of the sequence and the filter function selected to match the data being modeled. For example, an ARMA model employs an Auto-Regressive sequence with a Moving Average filter function.
Considering the various examples of jitter above it would seem reasonable to model jitter as the sum of a set of independent random processes, each comprising a series of impulses with a moving average filter function. This impulse driven moving average (IDMA) model can model the time varying nature of jitter and also be used to model jitter in IP network emulation models.
|
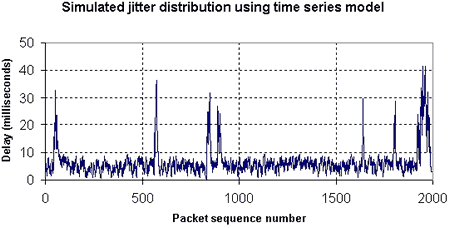
Figure 7. Simulated jitter distribution – “Access link congestion” |
A jitter metric based on this approach would comprise a description of the impulse distribution that would result in a time series that was statistically and operationally equivalent to that of the measured data.
The above example trace was generated using a simple five parameter model. The channel is assumed to be in one of two states. A constant background series of impulses S1 occurs with probability 0.5 and with amplitude A1. In the congested state (2) a second series of impulses S2 occurs with probability PS and with amplitude A2. The model switches between states 1 and 2 with transition probabilities P12 and P21 respectively. The output of the model is the filtered sum of S1 and S2.
For the “access link congestion” example above, A1=10, A2=50, P12=0.005, P21=0.05 and PS =0.3, and the filter function is a simple running average with scaling factor 4.
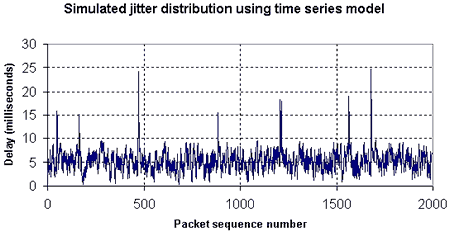
For the “LAN congestion” example below, A1=10, A2=50, P12=0.01, P21=0.5 and PS =0.3, and the filter function is a simple running average with scaling factor 4.
|
| Figure 8. Simulated jitter distribution – “LAN congestion” |
3.6 Jitter Buffer Emulation
Another approach that is used in at least three independent implementations is to model the operation of the jitter buffer – directly determining how many packets would have been discarded as a result of jitter. This has the advantage of being able to directly observe the time distribution of discard events and eliminates the step of trying to relate a jitter metric to a discard rate. If used as a jitter metric this would require a standardized jitter buffer to be used (as proposed in [3]).
4 Jitter Buffer – Jitter Interaction
4.1 Jitter Buffers
A jitter buffer is designed to remove the effects of jitter from the decoded voice stream, buffering each arriving packet for a short interval before playing it out. This substitutes additional delay and packet loss (discarded late packets) for jitter. A fixed jitter buffer maintains a constant size whereas an adaptive jitter buffer has the capability of adjusting its size dynamically in order to optimize the delay/discard tradeoff.
Both fixed and adaptive jitter buffers are capable of automatically adjusting to changes in delay. For example if a step change in delay of 20 milliseconds occurs then there may be some short term packet discards resulting from the change however the jitter buffer would be quickly realigned. In many cases the jitter buffer can be considered as a time window with one side (the early side) aligned with the recent minimum delay and the other side (the late side) representing the maximum permissible delay before a packet would be discarded.
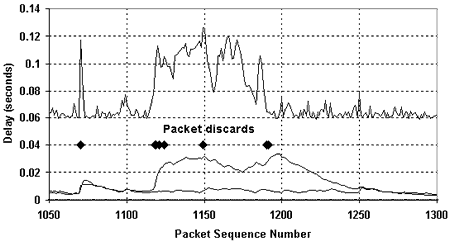
Figure 9 below shows an example of the relationship between discarded packets and the MAPDV2 and MPPDV jitter metrics described above. It can be seen that the packet-to-packet MPPDV metric does provide a reasonable indication of likely discards for isolated delayed packets but is not effective for larger congestion related jitter events.
|
| Figure 9. Relationship between discarded packets and jitter measures |
4.2 Adaptive Jitter Buffers
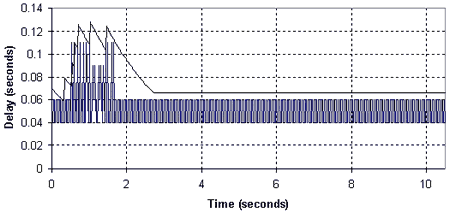
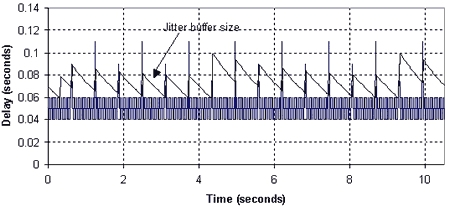
Adaptive jitter buffers generally react to either discard events or measured increase in jitter level. When a discard event is detected then the jitter buffer size is increased and when there is no discard event then the jitter buffer size is reduced.
 |
| Figure 10. Operation of an adaptive jitter buffer with widely spaced delay impulses typical of LAN congestion – in this case being adaptive doesn’t help |
|
| Figure 11. Operation of an adaptive jitter buffer with clustered delay impulses typical of congestion related jitter – in this case being adaptive does help |
If jitter events are widely spaced, as could occur with LAN congestion or frequent route changes, then the increase in size of the jitter buffer may be counter-productive, delay may increase but it may be sufficiently long until the next event that the buffer size has reduced. An adaptive buffer may be more help if jitter events are clustered, as would be typical for access link congestion.
As adaptive jitter buffers are becoming widely used, and their operation is quite sensitive to the distribution of jitter events, it would seem essential to measure jitter in a way which reflects this time distribution. A histogram based approach would not be sufficient to provide the information needed. Jitter buffer emulation can however provide a pragmatic solution and allows discard events to be directly estimated.
5 Approach to jitter modeling and measurement
As shown above, in order to model and measure jitter in a manner that reflects its time series characteristics and impact on jitter buffer operation it appears desirable to use several techniques.
(i) Modeling In order to produce plausible data for use in IP network emulation or simulation it is recommended that an impulse driven time series model be used.
(ii) Jitter measurement In order to measure jitter independently of any specific application it is recommended that the mean deviation from the short term average delay be used (MAPDV2 above) to produce a histogram that can be used to determine periods for which jitter would exceed bin levels.
(iii) Jitter impact In order to measure the impact that jitter would have on a VoIP service it is recommended that a jitter buffer emulator be used to directly estimate the number of packets that would be discarded.
6 Summary
This page provided a brief review of the causes and characteristics of packet delay variation or jitter, and discussed the merits of different approaches to measurement. A specific series of proposals were made to support “realistic” modeling and measurement of jitter.
7 References
- TIPHON 22TD047 Problems with the behavior of Jitter Buffers and their influence on the end-to-end speech quality, source KPN Research, March 2001
- RFC1889 Real Time Control Protocol
- Cole, R. Rosenbluth J. Voice over IP Performance Monitoring, AT&T Preprint September 2000
- ITU-T Y.1541 Network Performance Objectives for IP Based Services
- ITU-T SG12 D74 IP Phones and Gateways: Factors impacting speech quality, France Telecom, May 2002
Conditions of use: The material on this site is copyright VoIP Troubleshooter LLC and may be freely used but not copied or downloaded. In making use of this site the user acknowledges that VoIP Troubleshooter LLC or Contributor has no liability for any issues or problems that may arise directly or indirectly as a result of such use. VoIP Troubleshooter LLC and Contributor are providing this material as-is with no warranty as to correctness or completeness and do not accept any responsibility for any issues or problems of any nature whatsoever that may arise from the use of the material on this site.


